


Product Code: CANtrace
7 095,00 SEK
CANtrace is an easy-to-use CAN network analyzer, that lets you trace, decode and plot CAN messages and signals in real-time, or log everything for post processing in the comfort of your office.
It works with your current Kvaser, Softing, Vector, Peak and Total Phase hardware and it supports both CANopen and J1939 protocols. CANtrace supports also Python scripting and CAN FD.
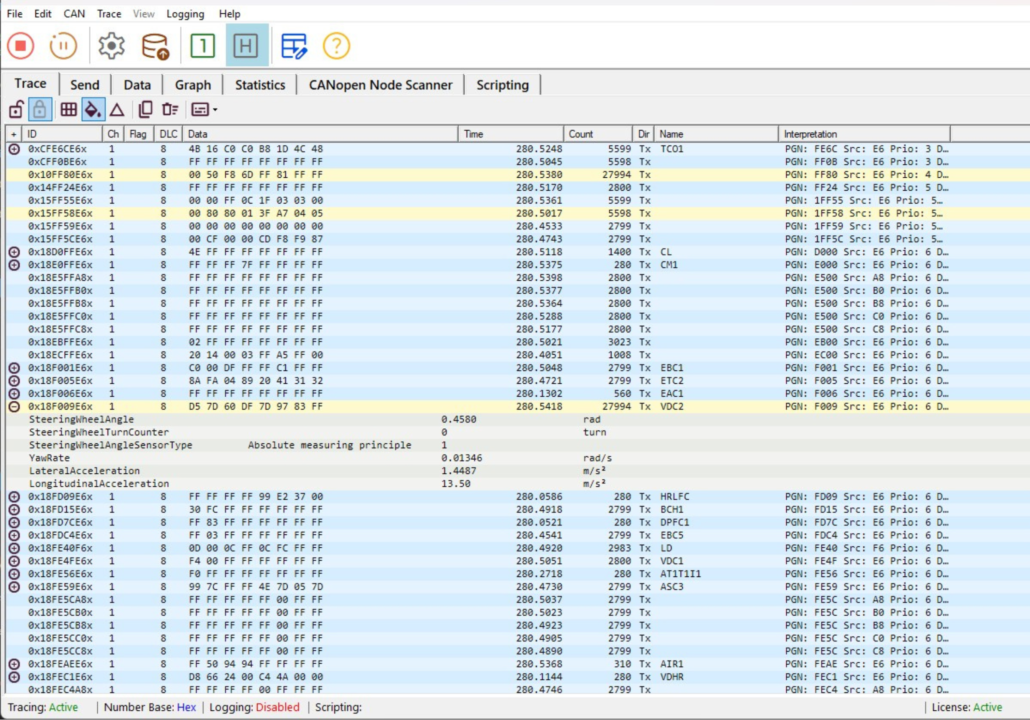
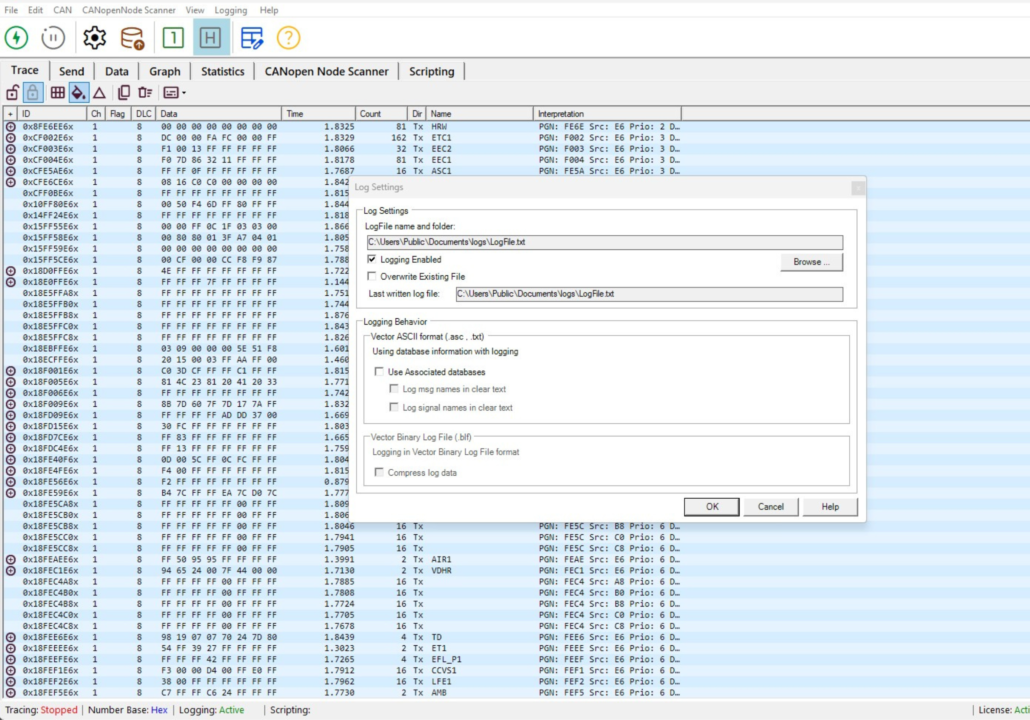
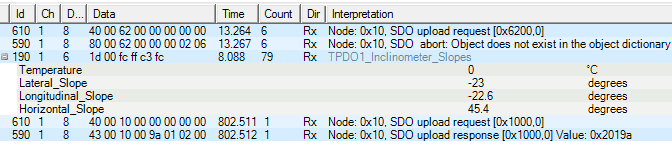
Data is transmitted on the CAN bus in 0-8 byte long messages, including a CAN ID and data length (DLC). And the message timestamp from your CAN interface, and that’s about all you get from a free CAN tool. CANtrace does the decoding with CANtrace you don’t have to decode the CAN data manually.
The included CANopen and J1939 protocol parser will decode protocol headers, while the connected databases (DBC) will decode signal values.
With CANtrace you don’t have to invest in expensive CAN hardware to get started. If you are like most CANtrace customers, your engineers already use at least one CAN interface, and with CANtrace it’s possible to tie your CANtrace license to your existing hardware.
If you own a CAN interface from any of the following manufacturers, it will work with CANtrace. For Kvaser, Softing, Vector, Total Phase hardware, the license is tied to the hardware. For Peak hardware, the license is tied to the PC. CANtrace can be shared by several people as long as you use the same Kvaser, Softing or Vector CAN hardware.
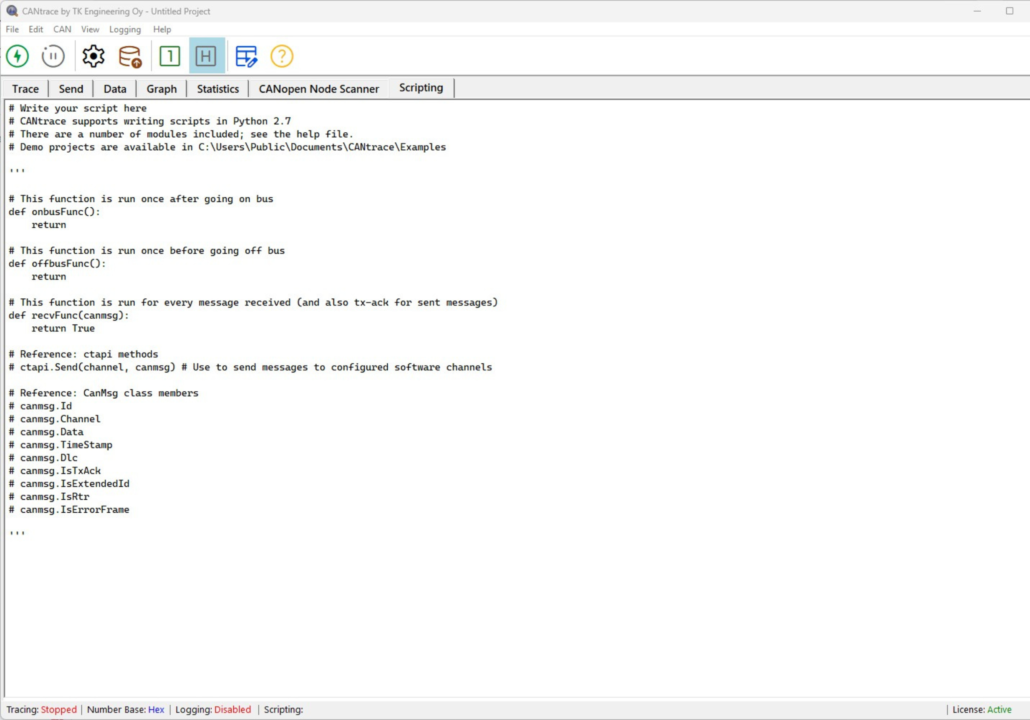
Users can use additional Python scripts inside the program to extend the default functionality of CANtrace. It has improved the built-in scripting, by including many common Python modules in the installer. Scripts can be used to create, filter, and modify signals dynamically for different uses. Descriptive example projects are also included in the public CANtrace folder.
CANtrace provides users with an extensive Python scripting environment, featuring a wide variety of common Python modules. User-created scripts can be run in real-time and used to modify, filter or create incoming and outgoing messages. This feature enables customisation of analysis workflows, automation of repetitive tasks, and extraction of more profound insights from CAN data.

CAN FD is now supported when using Kvaser CAN FD. Long CAN FD messages can be received and displayed in the trace window, signals from long CAN FD messages can be decoded and shown in the data and graph tabs. There is also full support for logging and playback of CAN FD messages in ASC format.
There’s now full support for multiplexed signals in databases. Multiplexed signals allows decoding complex CAN protocols and there’s now support added to the trace, data and graph tabs to display signals from multiplexed CAN messages. Also the send tab now allows you to easily edit and send messages that contain multiplexed signals.
We have also added time synchronization of the CAN channels, when going on-bus. This means that in multi-channel setups you will be able to compare timestamps between channels as they have the same time base. Multi-channel setups now benefit from time synchronization, ensuring consistent timestamps across channels.
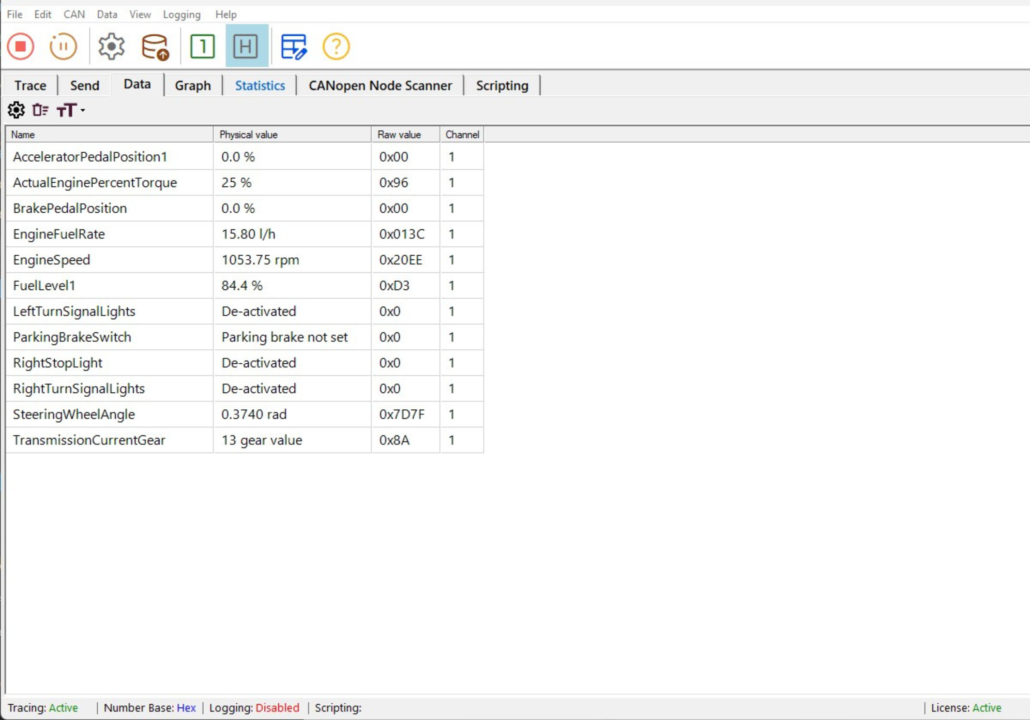
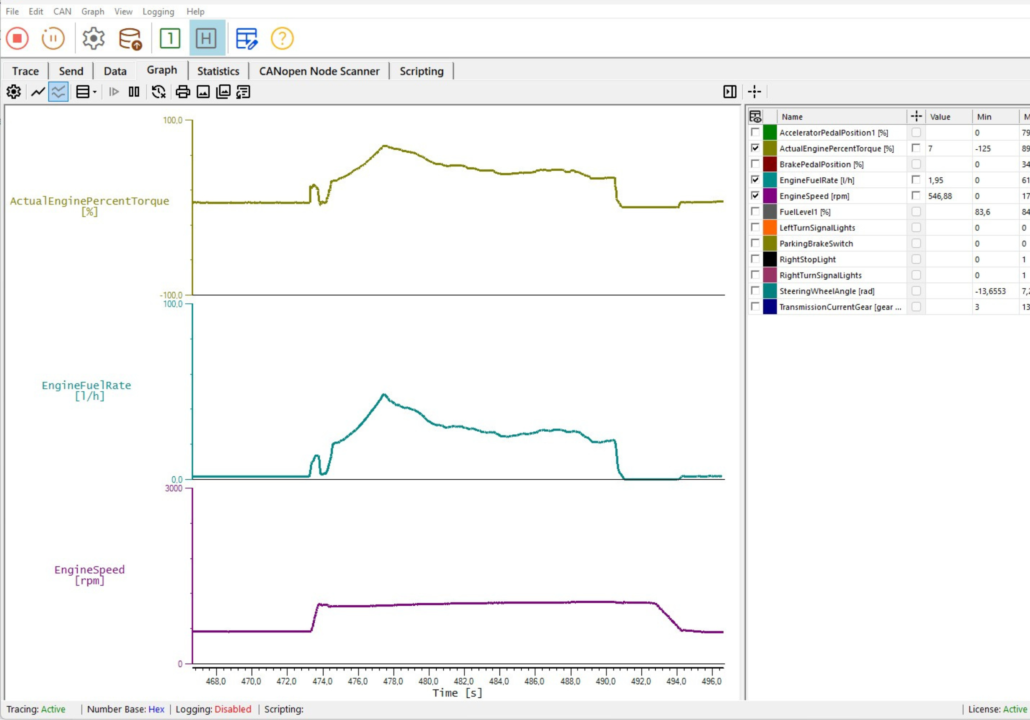
Many CAN messages contain several different data values, or signals, and it is a pain to manually decode the binary data. In CANtrace signals are decoded and displayed in human readable form. The real-world data from your CAN network can be monitored, logged and plotted using familiar engineering units. You will see the RPM and temperature in the same format you are used to.
Signals are decoded using your existing CAN database, in the commonly used DBC format. You can connect a separate database to every CAN interface (channel) and there is even a handy database editor included in CANtrace.
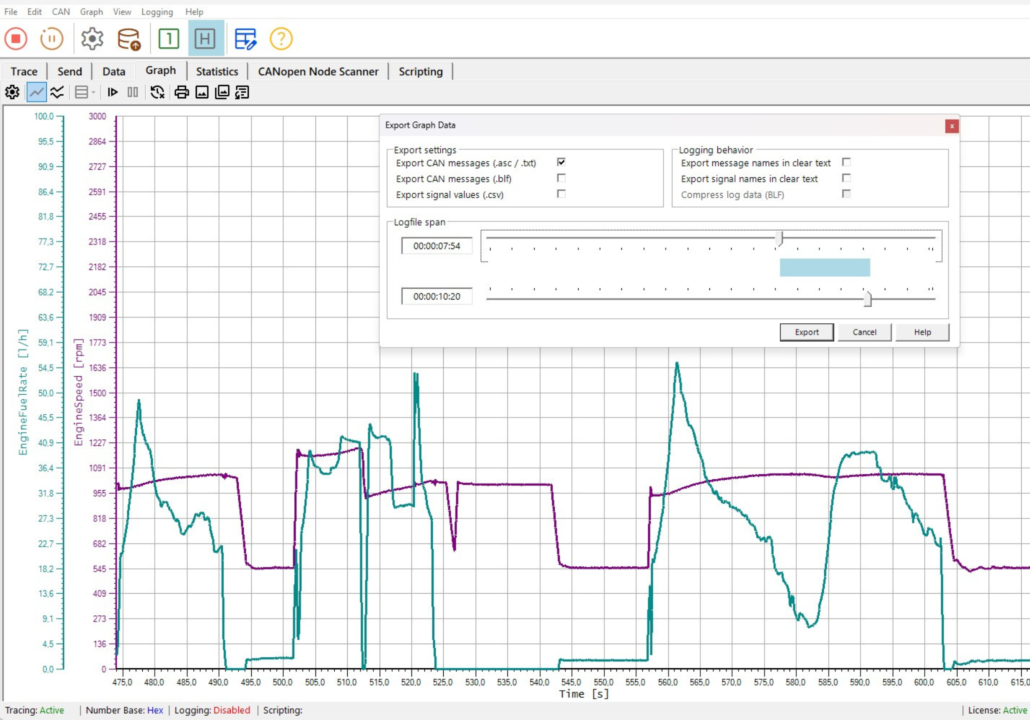
CANtrace features a powerful graphing tool that enables real-time plotting of signal values. You can easily plot multiple signals, switch between single and multi-view presentation modes, adjust the signal presentation, and manipulate the colour-coded signals using user-friendly controls. Utilise data cursors for precise measurements, and export your graphs for reports and documentation.
You can produce graphs from data you logged with any CAN logger, as long as it supports the popular Vector asc log format.
CANtrace supports Vector ASCII and BLF format CAN log files. In addition to recording log data from multiple channels. Any log file in ASC format can be used to generate data on the CAN bus. This feature can be very useful for simulation, testing and bus traffic generation.
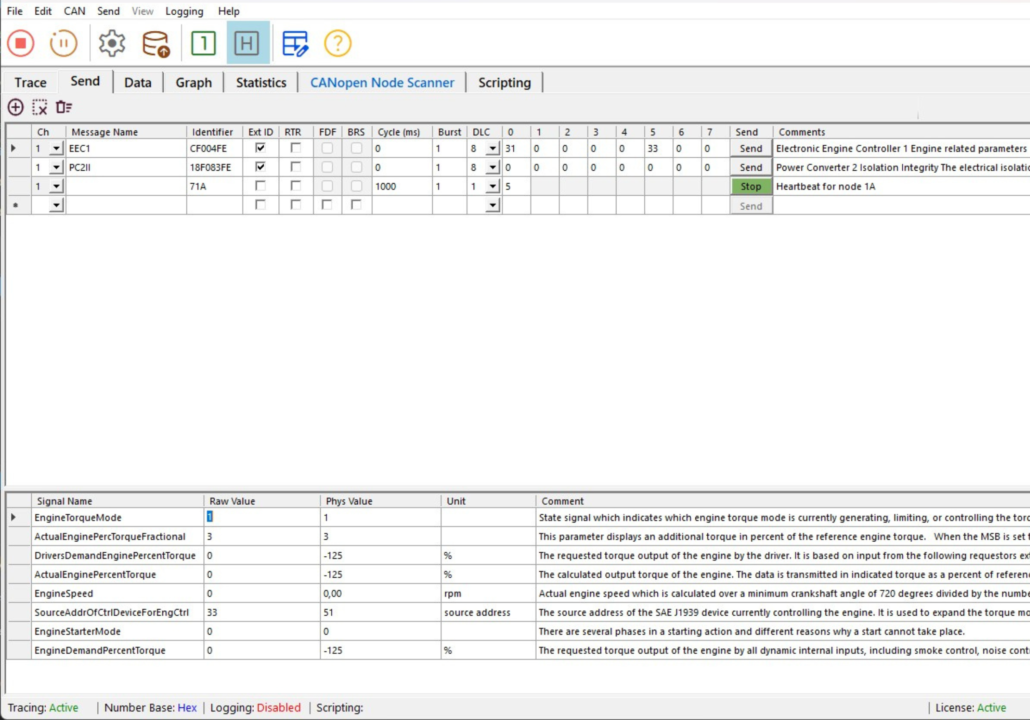
In the trace view, J1939 parameter groups (PG) are decoded to human readable format. In addition, CANtrace supports the J1939 transport layer protocol and can both send and receive suspect parameter embedded in transport layer segments. CANtrace comes with a J1939 database in DBC format. This allows natively decoding the standardized 8-byte J1939 messages that are specified in the SAE J1939 Digital Annex.
CANtrace also supports combining the included J1939 database with a customer-specific database. This enables the decoding of vehicle-specific parameters.
For J1939 format databases, CANtrace is able to mask out both priority, source address and destination address fields which allows the use of compact J1939 databases that works with a variety of different vehicles.
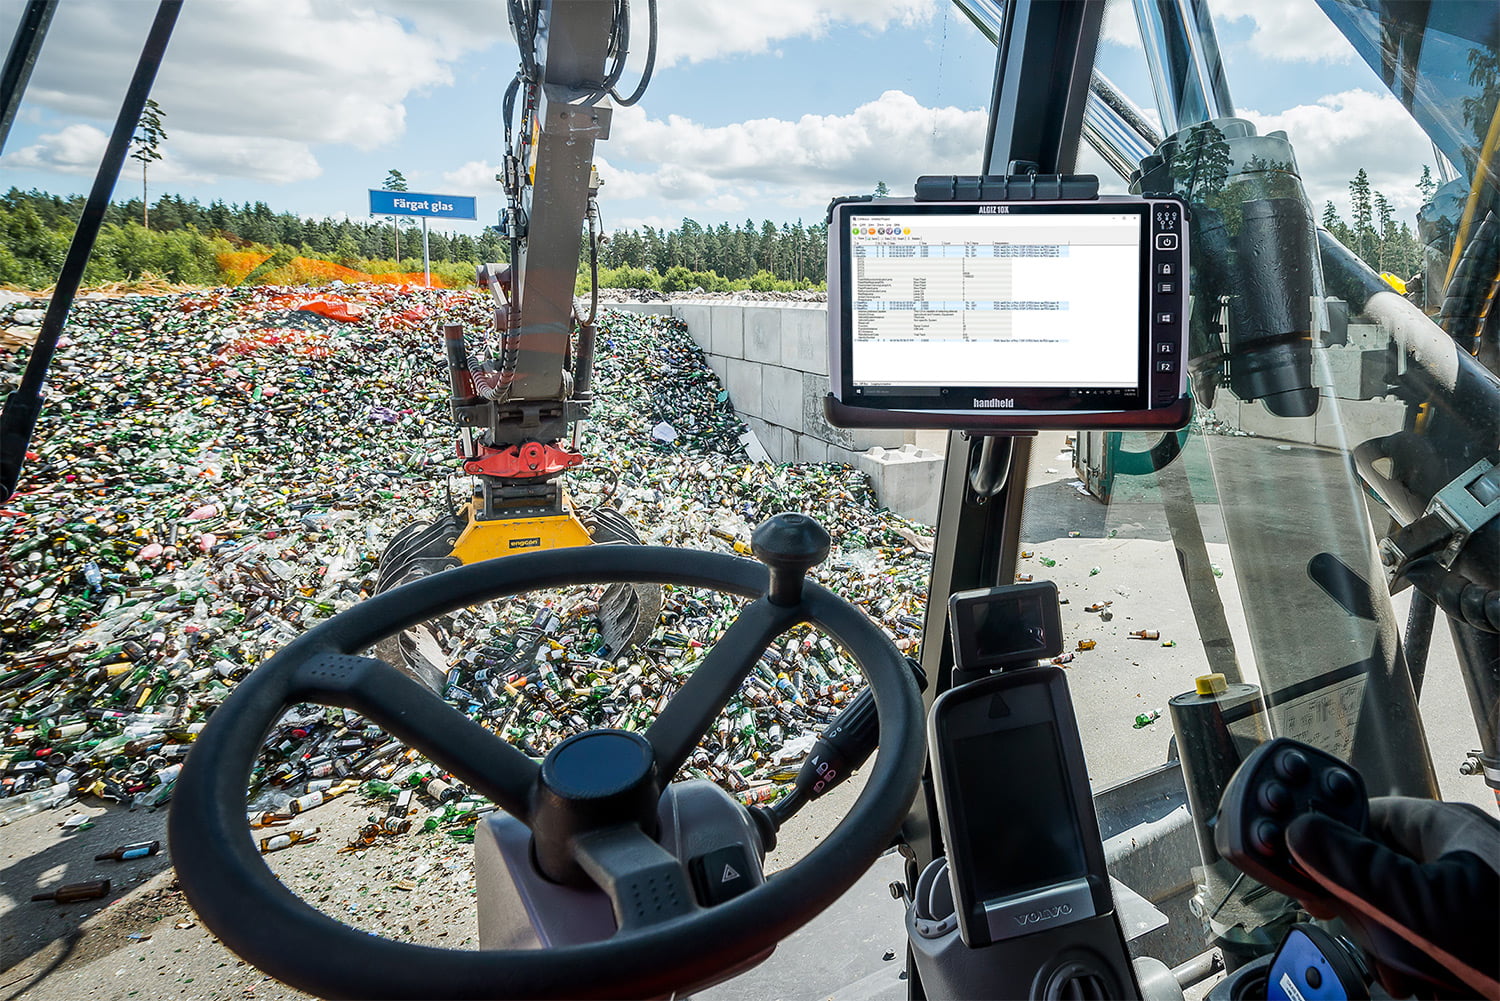
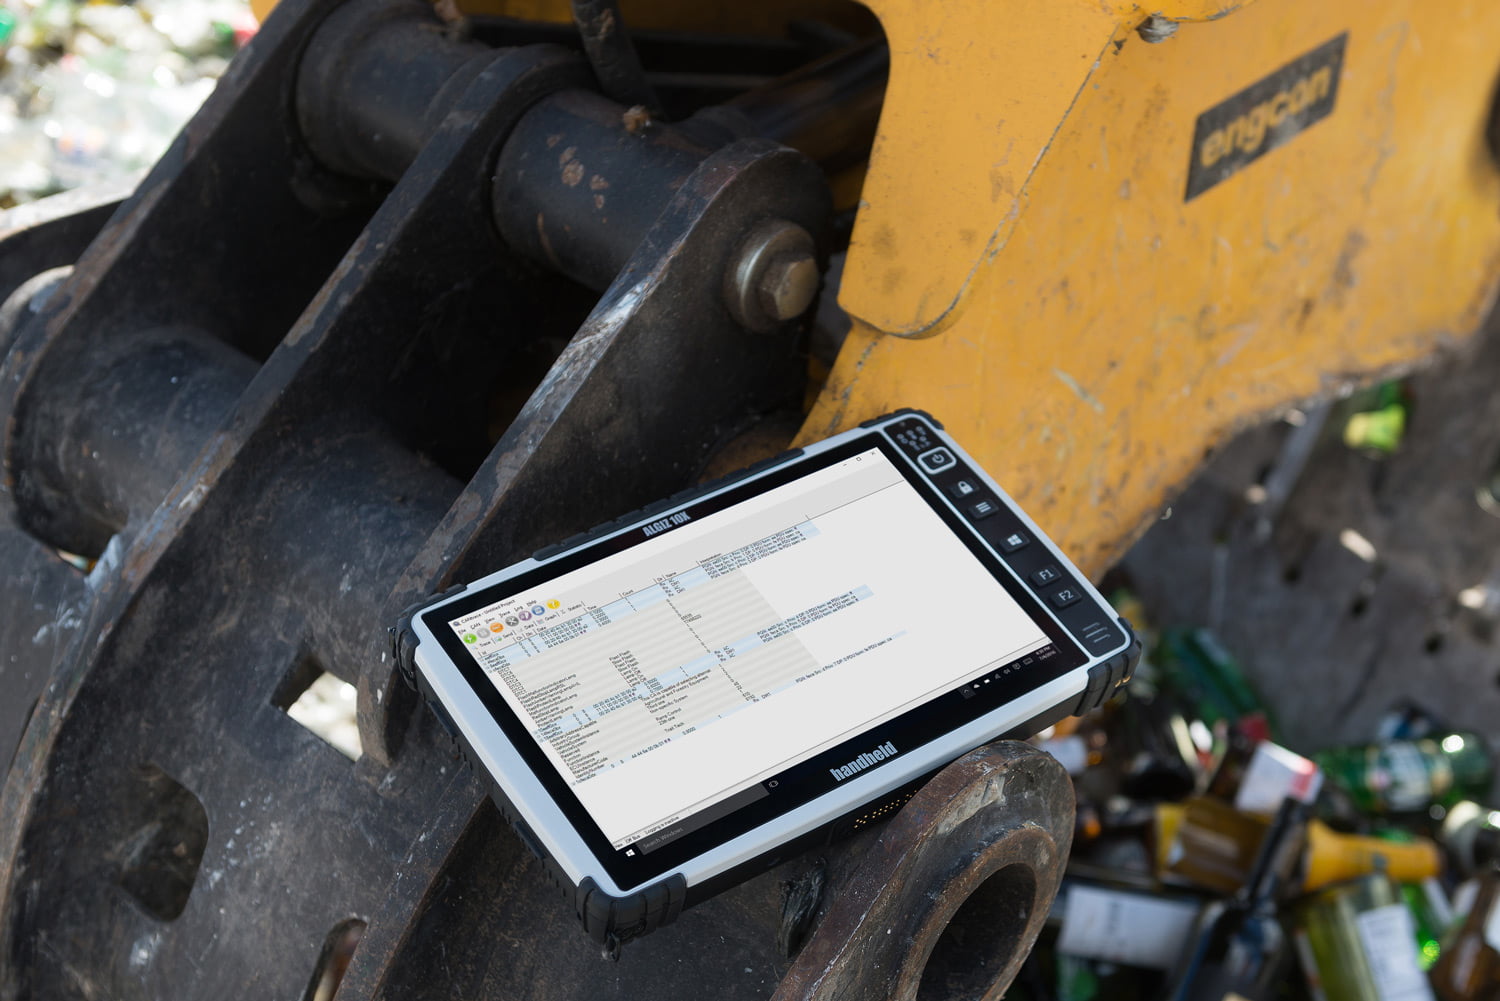
Designed from the ground up to be user-friendly and visually impressive, CANtrace ensures seamless performance on small laptops, handheld displays, and standard desktop monitors. Take your CAN toolbox anywhere with confidence! Install CANtrace on your rugged tablet PC and you will have a CAN logger you can leave for hours or days in the engine compartment of the equipment you are diagnosing.
It works with your current Kvaser, Softing, Vector or Peak hardware. Check that you have the driver of your CAN hardware installed on your PC. Download the driver from manufacturer’s website and install the driver manually