CANtrace Help
A powerful CAN bus analyser software and diagnostic tool

This tab displays all the messages on the CAN bus in raw format.
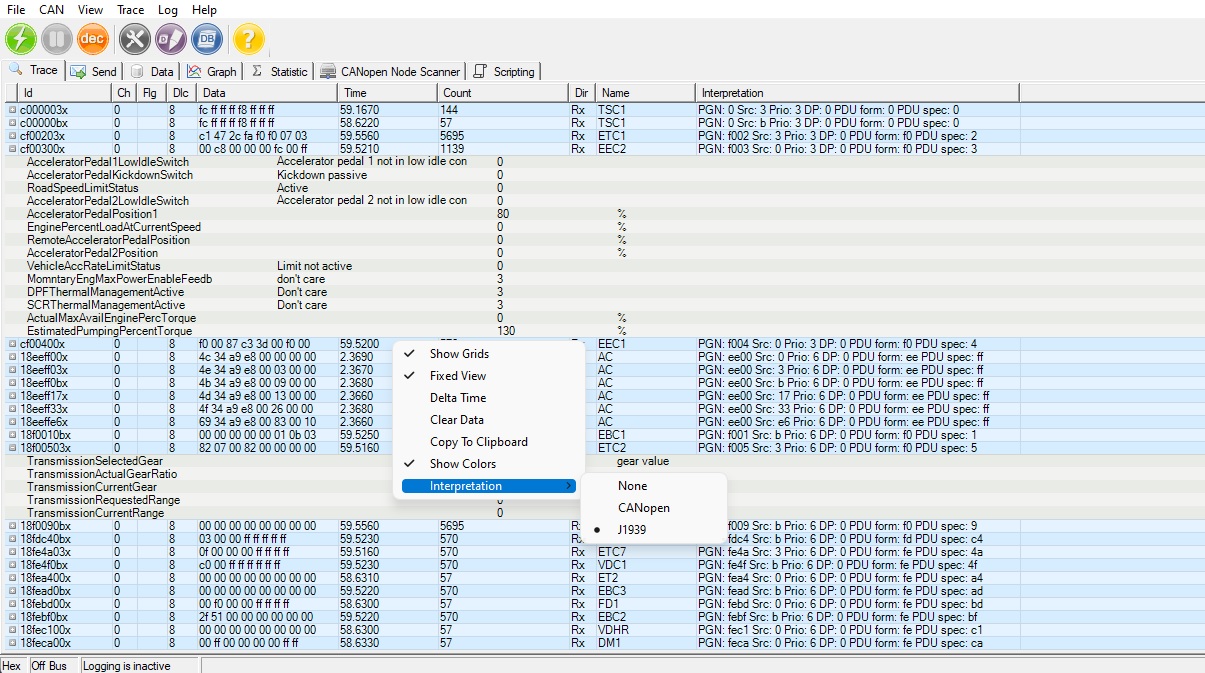
Figure 10.1 Trace tab
When right-clicking on the window, a menu appears (same menu in menu strip) with the following options:
| Menu Name | Description |
| Show Grids | Displays the grids. |
| Fixed View | For all the messages with same Id, Ch and Dir only display one line and only the latest message received will be displayed. |
| Delta Time | Enabled when Fixed View is enabled. Disabled in normal view. If this is checked in Fixed View, the time column will become Δt and will display the time interval between the two latest messages with same ID, Ch and Dir. |
| Clear Data | Clears all data in the current trace window. |
| Copy to Clipboard | Enabled when it’s Off Bus. Disabled when it’s On Bus. Copies the latest 1000 received messages to clipboard. |
| Show Colors | Shows the background colors |
| Interpretation | Displays the selected protocol message interpretation in the interpretation column. |
Table 10.1 Trace message columns explanation
| Column Name | Column Description |
| Id | Displays the CAN identifier. An “x” is added to the end of the identifier if it’s an extended ID and in hexadecimal mode. |
| Ch | Displays the application software channel of the CAN interface, from where the message is coming. |
| Flg | Displays the CAN frame flag(s). An empty column indicates that the row contains a Classic CAN frame, “F” indicates that the row contains a CAN FD frame, “FB” indicates that the sending node employs a Bit Rate Switch for the payload of this frame, and “FBE” indicates an Error flag. |
| Dlc | Displays the data length of the CAN message. |
| Data |
Displays the data of the CAN message received. |
| Time | Displays the time when message is received. Timestamps start from zero when you go On Bus. When delta time in fixed view is enabled, this column becomes Δt and displays the time interval between two latest messages with same ID, Ch and Dir. |
| Count | Displays how many times a message has been received. |
| Dir | Shows direction of the received message. If it’s sent from CANtrace, it’s Tx, otherwise Rx. |
| Name | Shows the name of the message if the message can be found from the database file. |
| Interpretation | Displays the selected protocol interpretation |
Fixed View, messages can be sorted by any column, in both off-bus and on-bus state.
By default, messages are sorted according to Id in ascending order. The user also has the option to sort messages by channel, flag, dlc, data, timestamp, delta-time, count, direction, name or interpretation by clicking on the corresponding column headers.
When the sort-by column is changed by clicking on another column header, the messages default to being sorted in ascending order according to that column. Every subsequent click on the same column header will toggle the sort order between ascending and descending.
Going on-bus resets any previously set sort order to the default.
If a database (DBC) is associated with a software channel, the signal data will also display in the fixed view of the trace tab.
Every message that has an entry in the database will have a plus sign that you can click to open the signal list, which is displayed below the message.
Signals are sorted, in ascending order, according to their start bit in the message.
Signal values from the database are shown as physical values with the scaling and unit as specified in the database. If a signal has a value table in the database, a textual description corresponding to the value is also displayed.
Scaled physical values are shown with some specific number of decimals based on the factor. If the resulting value has too many characters to fit in its designated column, the value is instead shown in either fixed-point or scientific notation, depending on which one is more compact.
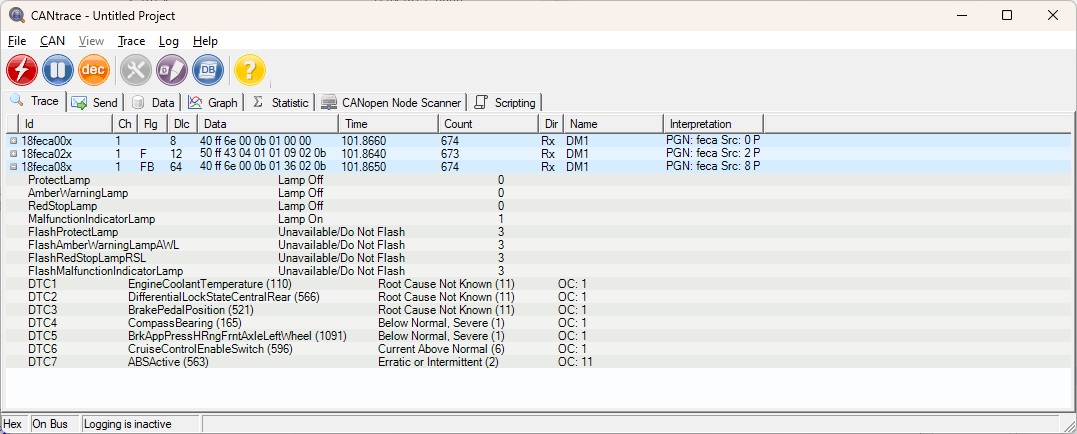
Figure 10.2 Trace window and expanded messages
The timestamps of the received and transmitted messages begin from zero after going on bus. The timestamps are displayed in seconds with a resolution of 0,0001 seconds in the trace window while six fixed decimal digits will be logged to the log file. If a specific CAN interface doesn’t support time stamps for transmitted or received messages, the time stamp is generated by the PC clock. Please go to Interface Settings section to check if your interface supports time stamp or not.
When decoding a signal where the J1939 database contains the attribute SigType=DTC for Diagnostics Trouble Codes, the trace window will decode those signals to show the SPN, FMI and OC, and will also show the text representation of the SPN and FMI.

