CANtrace Help
A powerful CAN bus analyser software and diagnostic tool

This tab displays a graphical representation of the chosen signals.
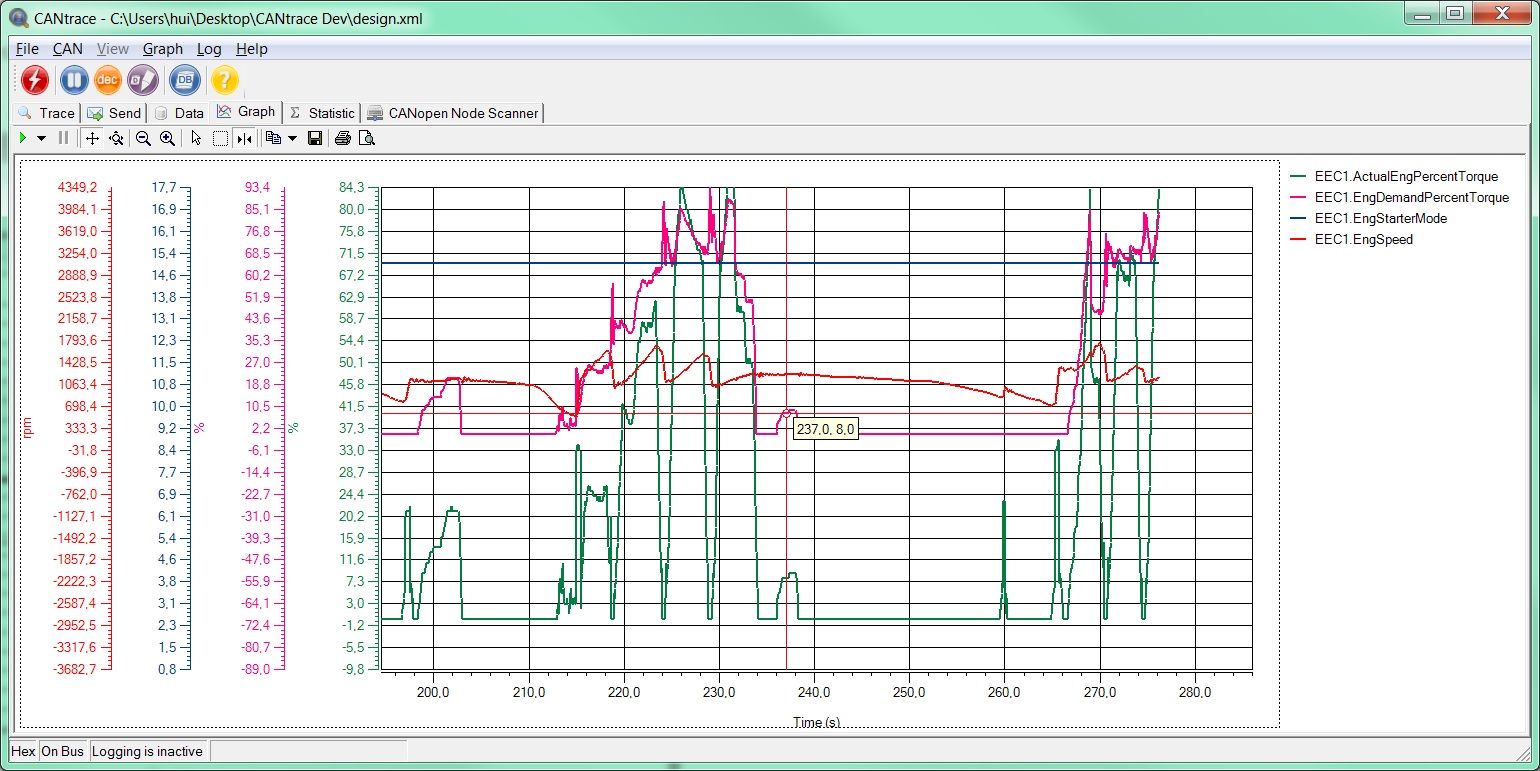
Figure 10.8 Graph view
Before adding a signal to the Graph tab, the user needs to add a database. Click here to see how to add a database.
To add, remove or configure signals, just right click the Graph window and choose Configure Signals from the menu. The below dialog box will appear.
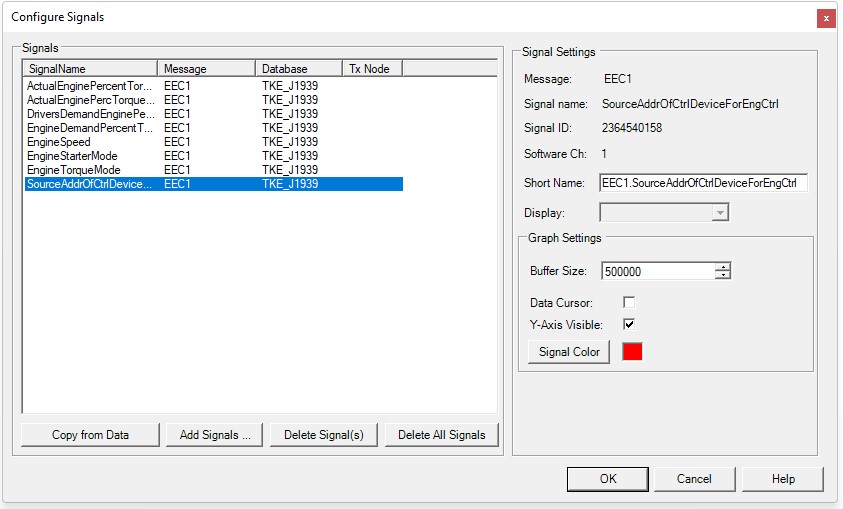
Figure 10.9 Configure Signals Dialog
Table 10.5 Configure Signals Form Description
| Name | Description |
| Copy from Data | Copy the configured signals from the Data tab if there are any |
| Add Signals… | Add signals from the associated database |
| Delete Signal(s) | Delete the chosen signals |
| Delete Signals | Delete all signals on the graph window |
| Short Name: | Signal name that is editable. You can define your own name of the signal that will be shown graphically. E.g. the signal name is EngSpeed, you can define rpm as the short name. NOTE! Doesn’t change database This doesn’t change the original associated database file, it only changes the name shown on graph window |
| Buffer Size: | The size of the buffer to store the data points of the signal. Once the maximum number is exceeded, the very old data will be replaced by the new data. |
| Data Cursor: | Enable/disable data cursor for the selected signal. If the Data Cursor icon on tool bar is pressed, the enabled data cursor for the selected signal will be shown. See below section Data Cursor for more information |
| Y-Axis Visible: | Configure to show/hide the y-axis for the selected signal. To display the y-axis again, open Configure Signals dialog and check the box. |
| Signal Color | Configure the color shown for the signal in the graph. |
Buttons:
OK – Saves and applies the configuration and closes the dialogue
Cancel – Discards the configuration and closes the dialogue
Help – Opens the Graph Window section in the help document
Figure 10.10 Graph toolbar
Table 10.6 Graph icon
| Icon | Description |
| Resumes all tracking on all axes | |
| Pauses tracking on all axes. The graph window will be paused while the drawing continues. | |
| Axes scrolling, click on the axis and move upwards/downwards to move the location of the signal’s graph | |
| Axes zoom, click on the axis and move upwards/downwards to zoom in/out the signal’s y-axis. By clicking on the graph, you can zoom in/out the whole graph vertically (x-axis) and horizontally (y-axis) | |
| Zoom-out, zoom out the selected y-axis or the whole graph | |
| Zoom-in, zoom in the selected y-axis or the whole graph | |
| Select | |
| Zoom-box, zoom in the selected area | |
| Data-cursor, enables/disables data-cursor feature for the configured signals (Data cursor is checked while configuring the signals) | |
| Copy to clipboard, copy the whole graph or copy only the x-axis and y-axis values of all the configured signals to clicpboard | |
| Save the graph | |
| Print preview |
By using the mouse, it is possible to zoom, both vertically and horizontally. Click on the axis you want to zoom and hold down the Ctrl key. Use the mouse for actual zooming. If you only want to move on the axes or move the signals just grab the axis and then scroll or move your mouse.
Zooming in or out on the y-axis changes the precision (decimal amount) displayed on the y-axis. Decimals are added or decreased to fit the y-axis values. Still each y-axis has a maximum precision taken from the associated database that can’t be exceeded.
Once you have checked the Data Cursor box in the Configure Signals dialog box and the Data Cursor tool bar button is pressed, you will be able to see the data cursor for the selected signals. As seen in the figure below, you can configure the display mode for the selected cursor by right-clicking on it.
You can also change the location of the value on the cursor by dragging it to the location you want (left click mouse and hold to drag).
Data cursor values are taken from each respective axis with the same precision (decimal amount).
Table 10.7 Data Cursor Description
| Name | Description |
| Hide | To hide the chosen cursor. The cursor will be shown again if you disable and enable Data Cursor button on the toolbar |
| Style |
To change the display style of the data cursor. You can configure to display only x-axis value or y-axis value or both values and you can measure period, peak to peak and frequency of the signal |
| Channel | To assign the current cursor to other signals. The color of the data cursor will be changed to the same color of the target channel/signal. The data cursor is still associated with the original signal you have configured in the Configure Signals dialog no matter which signal it is assigned to currently on the graph window |
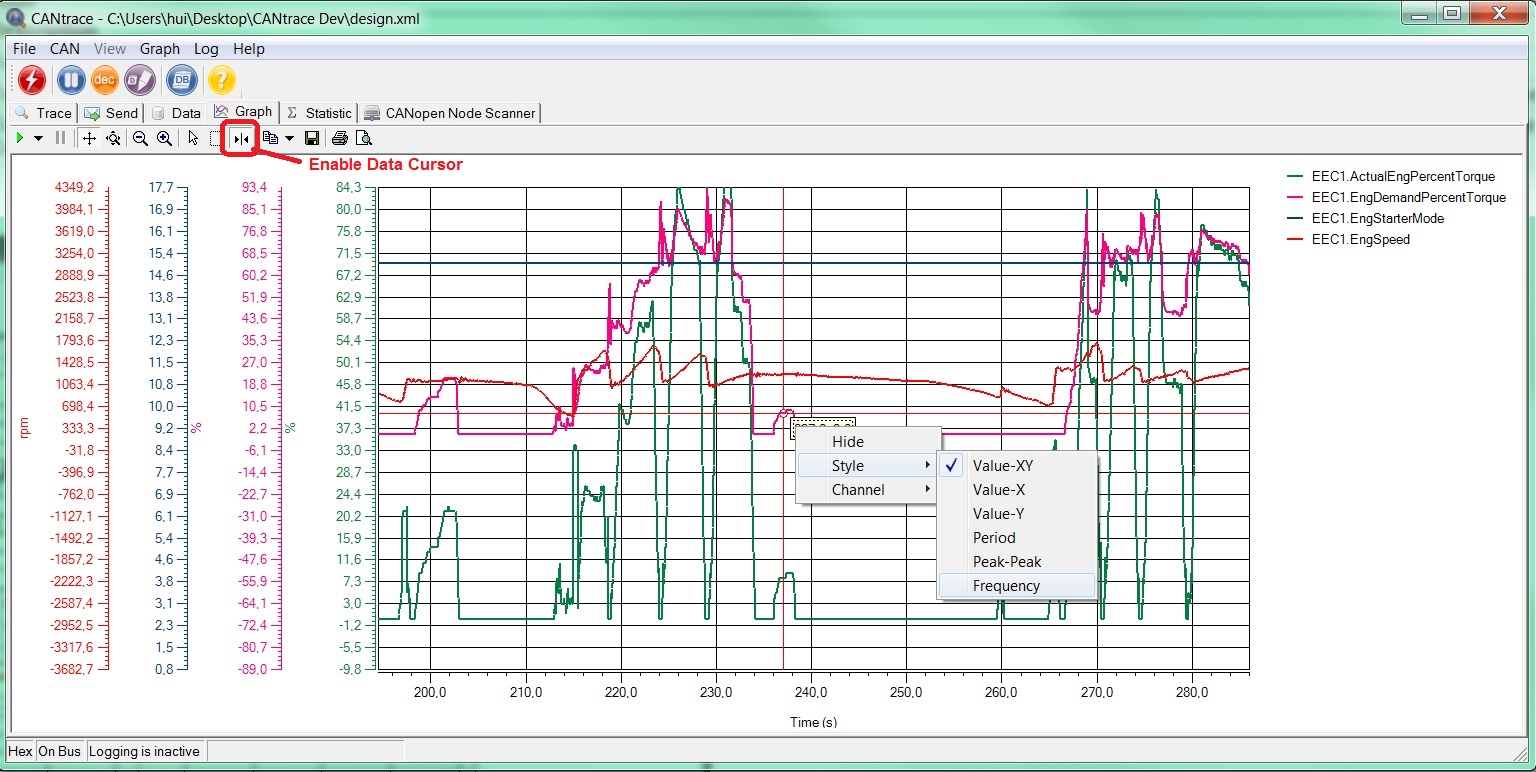
Figure 10.11 Data Cursor

