CANtrace Help
A powerful CAN bus analyser software and diagnostic tool

This chapter describes the basic system requirements for CANtrace. The installation procedure and how to use command prompt to start CANtrace.
CANtrace can be run on the following platforms:
CANtrace requires a computer with a minimum of 1GB of RAM and 100 MB of free disk space. CANtrace is designed primarily for 13-15 inch screens, but it works with any screen resolution of 800×600 or higher.
CANtrace is fully usable without an Internet connection.
After you have downloaded the CANtrace zip file, please extract the files to a folder. Then double click the executable file and follow the wizard which will guide you through the installation process. The installation process needs administrative rights.
CANtrace is targeted at .Net Framework 4.5. The installer will run the Windows .Net Framework 4.5 web installer if your PC doesn’t have .Net Framework 4.5 installed.
After the installation is finished, you can execute CANtrace from the desktop icon (if selected to create one) or from the Windows start menu.
This section describes the basic user interface of the CANtrace program.
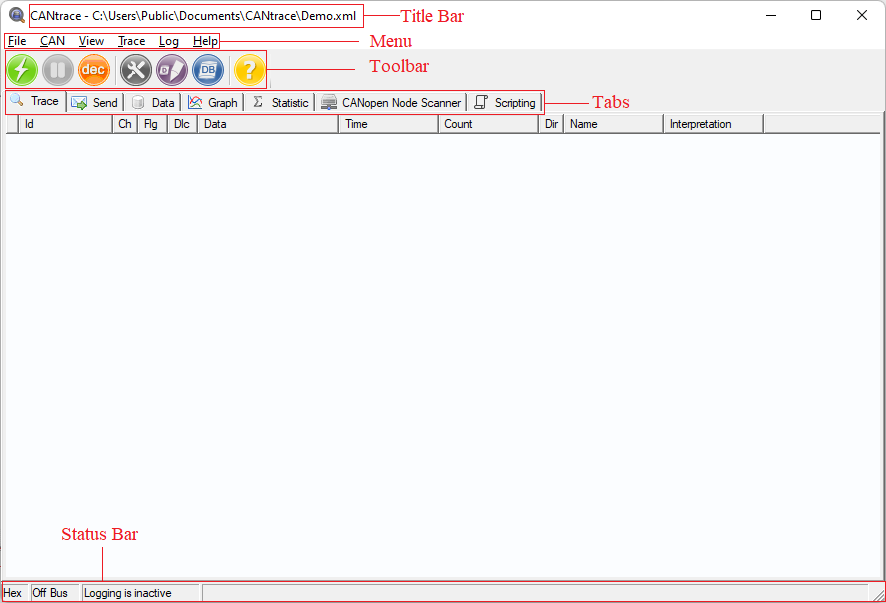
Figure 2.1 CANtrace UI
The program title bar displays the path of the project file you have opened with CANtrace.
The status bar displays the current data and ID’s format, the current on/off bus status and the status of the logging.
Table 2.1 Menu description
| File | File menu offers commands for creating, loading and saving project files and for configuring database (DBC) files and opening Kvaser Database Editor program. See Project File for more information. |
| CAN | Offers commands for setting up CAN interfaces in CANtrace and go on/off bus commands. See CAN Settings for more information. |
| View | To set which tabs should be visible or invisible. |
| Trace | Here displays the name of the current selected tab. See Tabs for more information. |
| Log | Offers commands for configuring logging and DBC logging. See Logging for more information. |
| Help | Offers commands for opening help document (this document) and import license. See License for more information. |
The toolbar offers you a more convenient way to reach the most commonly used commands.
Table 2.2 Toolbar description
| Picture | Name | Description |
| Start | Initialize the configured CAN interfaces and then Go on bus/Start tracing. | |
| Stop | Configured CAN interfaces Go off bus/Stop tracing. | |
| Pause Trace | The program pauses tracing and stores received data in a pause buffer for replay when resume is pressed. It also pauses logging to file. | |
| |
Resume Trace | The program resumes tracing bus-messages and data buffered during the pause is now replayed. If “Logging while OnBus” is set, then the program also resumes logging to file. |
| HEX – formatting | All data and ID(s) are displayed in hexadecimal format. | |
| |
DEC – formatting | All data and ID(s) are displayed in decimal format. |
| CAN Settings | Opens the CAN-Interfaces Settings window. This button is disabled while on bus. | |
| Kvaser Database Editor | Opens the Kvaser Database Editor. This software is installed while CANtrace is installed, but it’s not removed when you uninstall CANtrace. | |
| Associate Database | Add, remove or edit databases. | |
| Help | Opens the help document (the document you are reading now) |
Status Bar displays if CANtrace is on Decimal or Hexadecimal mode, On/Off Bus, If logging is active/inactive, and Python script status.
This section will explain how to set up a CAN device and go on bus.
1. First, you must set up the CAN device parameters correctly corresponding to the CAN network and CAN interface. You can set the parameters by going to CAN in the menu bar, then selecting Settings.
Figure 2.2 CAN->Settings Menu
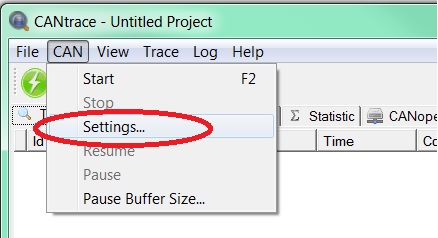
Figure 2.2 CAN->Settings Menu
How to set up Vector can be found here
How to set up Castor USB can be found here
How to set up Kvaser can be found here
How to set up Peak can be found here
2. Second, you can start tracing by going to CAN > Start. Alternatively, use the shortcut key F2.
Figure 2.3 CAN->Start Menu
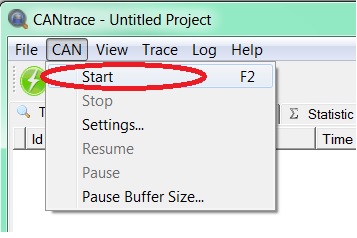
Figure 2.3 CAN->Start Menu
OR press on the button in tool bar:
![]()
Note : The license is tied to the serial number of a CAN interface or to the serial number of the PC.
If no licensed hardware is found when going on bus all CAN interfaces are set to inactive and they need to be manually activated in CAN->Settings dialogue after a new license has been added or a licensed hardware has been connected to the computer.
2.5.1 CANtrace Project File
A CANtrace Project File is a configuration file that stores a project’s settings and data. These project files use the .cantrace extension and are essential for saving and loading project settings. The project file allows users to easily manage configurations and makes it possible to return to a project later with the same settings.
Functions You Can Perform with a CANtrace Project File:
File Format Options:
Within CANtrace, the Open and Save dialog boxes allow you to choose between two file formats for saving and opening projects:
Figure 2.4 File menu
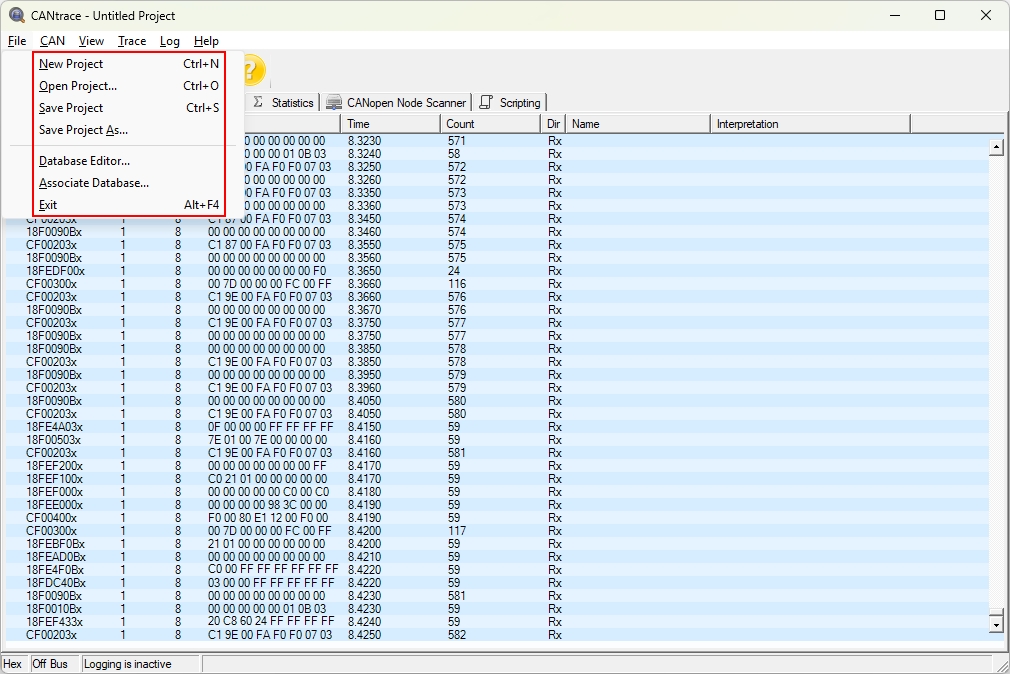
Table 2.3 File Menu Overview:
The File menu provides various options for managing your CANtrace projects. Here’s a breakdown of each option:
| Name | Description |
|---|---|
| New Project | Create a new, empty project. |
| Open Project… | Open an existing project file. Allowed file extensions are .cantrace or .xml. |
| Save Project | Save the current project in the chosen folder. If no name or location is set, “Save As” will be activated. |
| Save Project As… | Save the project with a new name and location. Allowed file extensions are .cantrace or .xml. |
| Database Editor… | Open Kvaser’s Database Editor. |
| Associate Database… | Open the Associate Database form. |
| Exit | Close the CANtrace program. |
Note: The most recently saved or opened project file will automatically load when CANtrace restarts. However, if you open a .cantrace project file by double-clicking it in Windows Explorer or using the command prompt, that file will take priority over the automatically loaded one.
CANtrace can also open project files that were saved in different versions of the program, provided that the file format has not been altered. If the project file is not compatible, you will receive a notification message.
Important: Do not modify the contents of the project file using other programs. This could cause the file to become unreadable or incompatible with CANtrace.
2.5.2 File Path Handling in Project Files
CANtrace uses both relative and absolute paths to manage file locations within a project, ensuring flexibility and portability.
Relative Paths: If a referenced file, such as a playback log file, log file, DBC log file or database file , is located in the same directory as the project file or within its sub-directories, CANtrace stores the path as a relative path. Alternatively, it may convert the path using Windows environment variables to enhance portability.
Absolute Paths: If a referenced file is located outside the project file’s directory, CANtrace stores the file location as an absolute path.
Regardless of how file paths are stored, within the CANtrace application, all file references are converted to and used as absolute paths during operation.
The following keyboard shortcuts can be used within CANtrace.
| Key | Effect |
|---|---|
| F1 | Opens the context appropriate section of the help file. |
| Ctrl + F1 | Open the help file. |
| Ctrl + N | Create a new project. |
| Ctrl + O | Open an existing project. |
| Ctrl + S | Save the current project. |
| Alt + F4 | Close the CANtrace program. |
You can customize the startup of CANtrace using the command line arguments via command prompt. The following arguments are supported:
conf=[path]
tabs=[1/0][1/0][1/0][1/0][1/0][1/0][1/0] (i.e. tabs=0101010)
onbus=[1/0]
deftab=[n], 1–Trace, 2 – Send, 3 – Data, 4 – Graph, 5 – Statistic, 6 – CANopen Node Scanner, 7 – Scripting
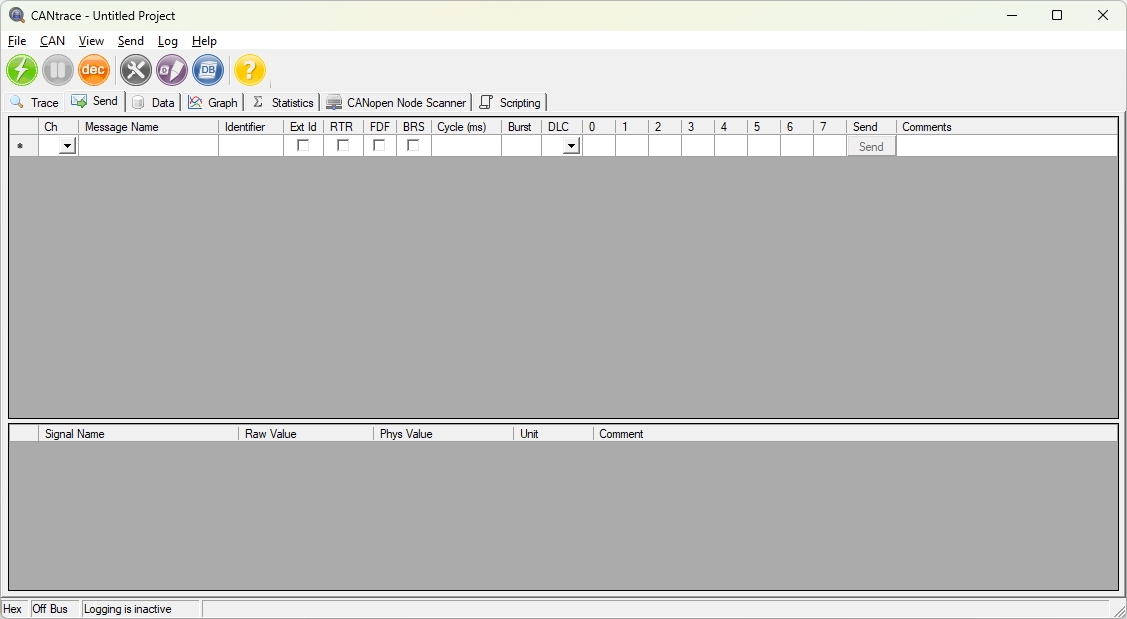
Below two figures show an example of using command line arguments. It will start CANtrace. The default tab that is opened is Send tab, only tab Trace, Send and Graph are displayed. The status is off bus.
Figure 2.5 Example of using Command line parameters
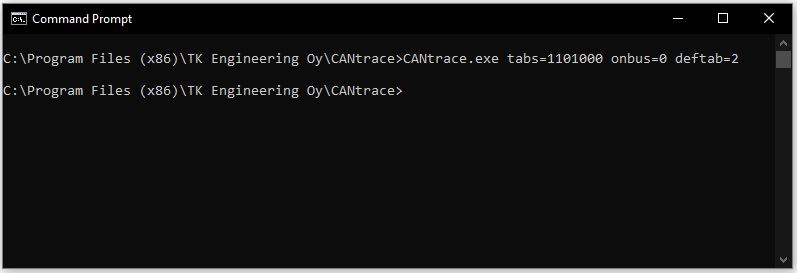
Figure 2.6 CANtrace Startup
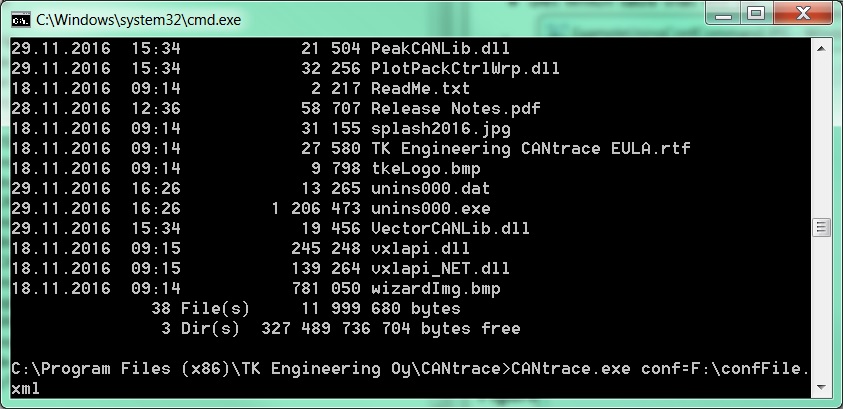
Below figure shows an example of opening a project file called configFile.xml located in F:\ when CANtrace starts.
Note: If you open a project file from the command line, the last saved project file will not be remembered by CANtrace. This is because the file specified on the command line has the highest priority.
Figure 2.7 Using conf command
If you want to uninstall CANtrace, please go to Control Panel > Programs > Uninstall a program, then right-click on CANtrace and select Uninstall.
The Kvaser Database Editor, which is installed automatically when CANtrace is installed, needs to be uninstalled manually. Select Control Panel > Programs > Uninstall a program, then right-click on Kvaser Database Editor 3 and select Uninstall.

